Mid-October 2025-26 season-to-date review

The latest international break gives us an opportunity to look back at the season so far, and to look ahead so that we can understand what might be coming next.
The squad
Injuries
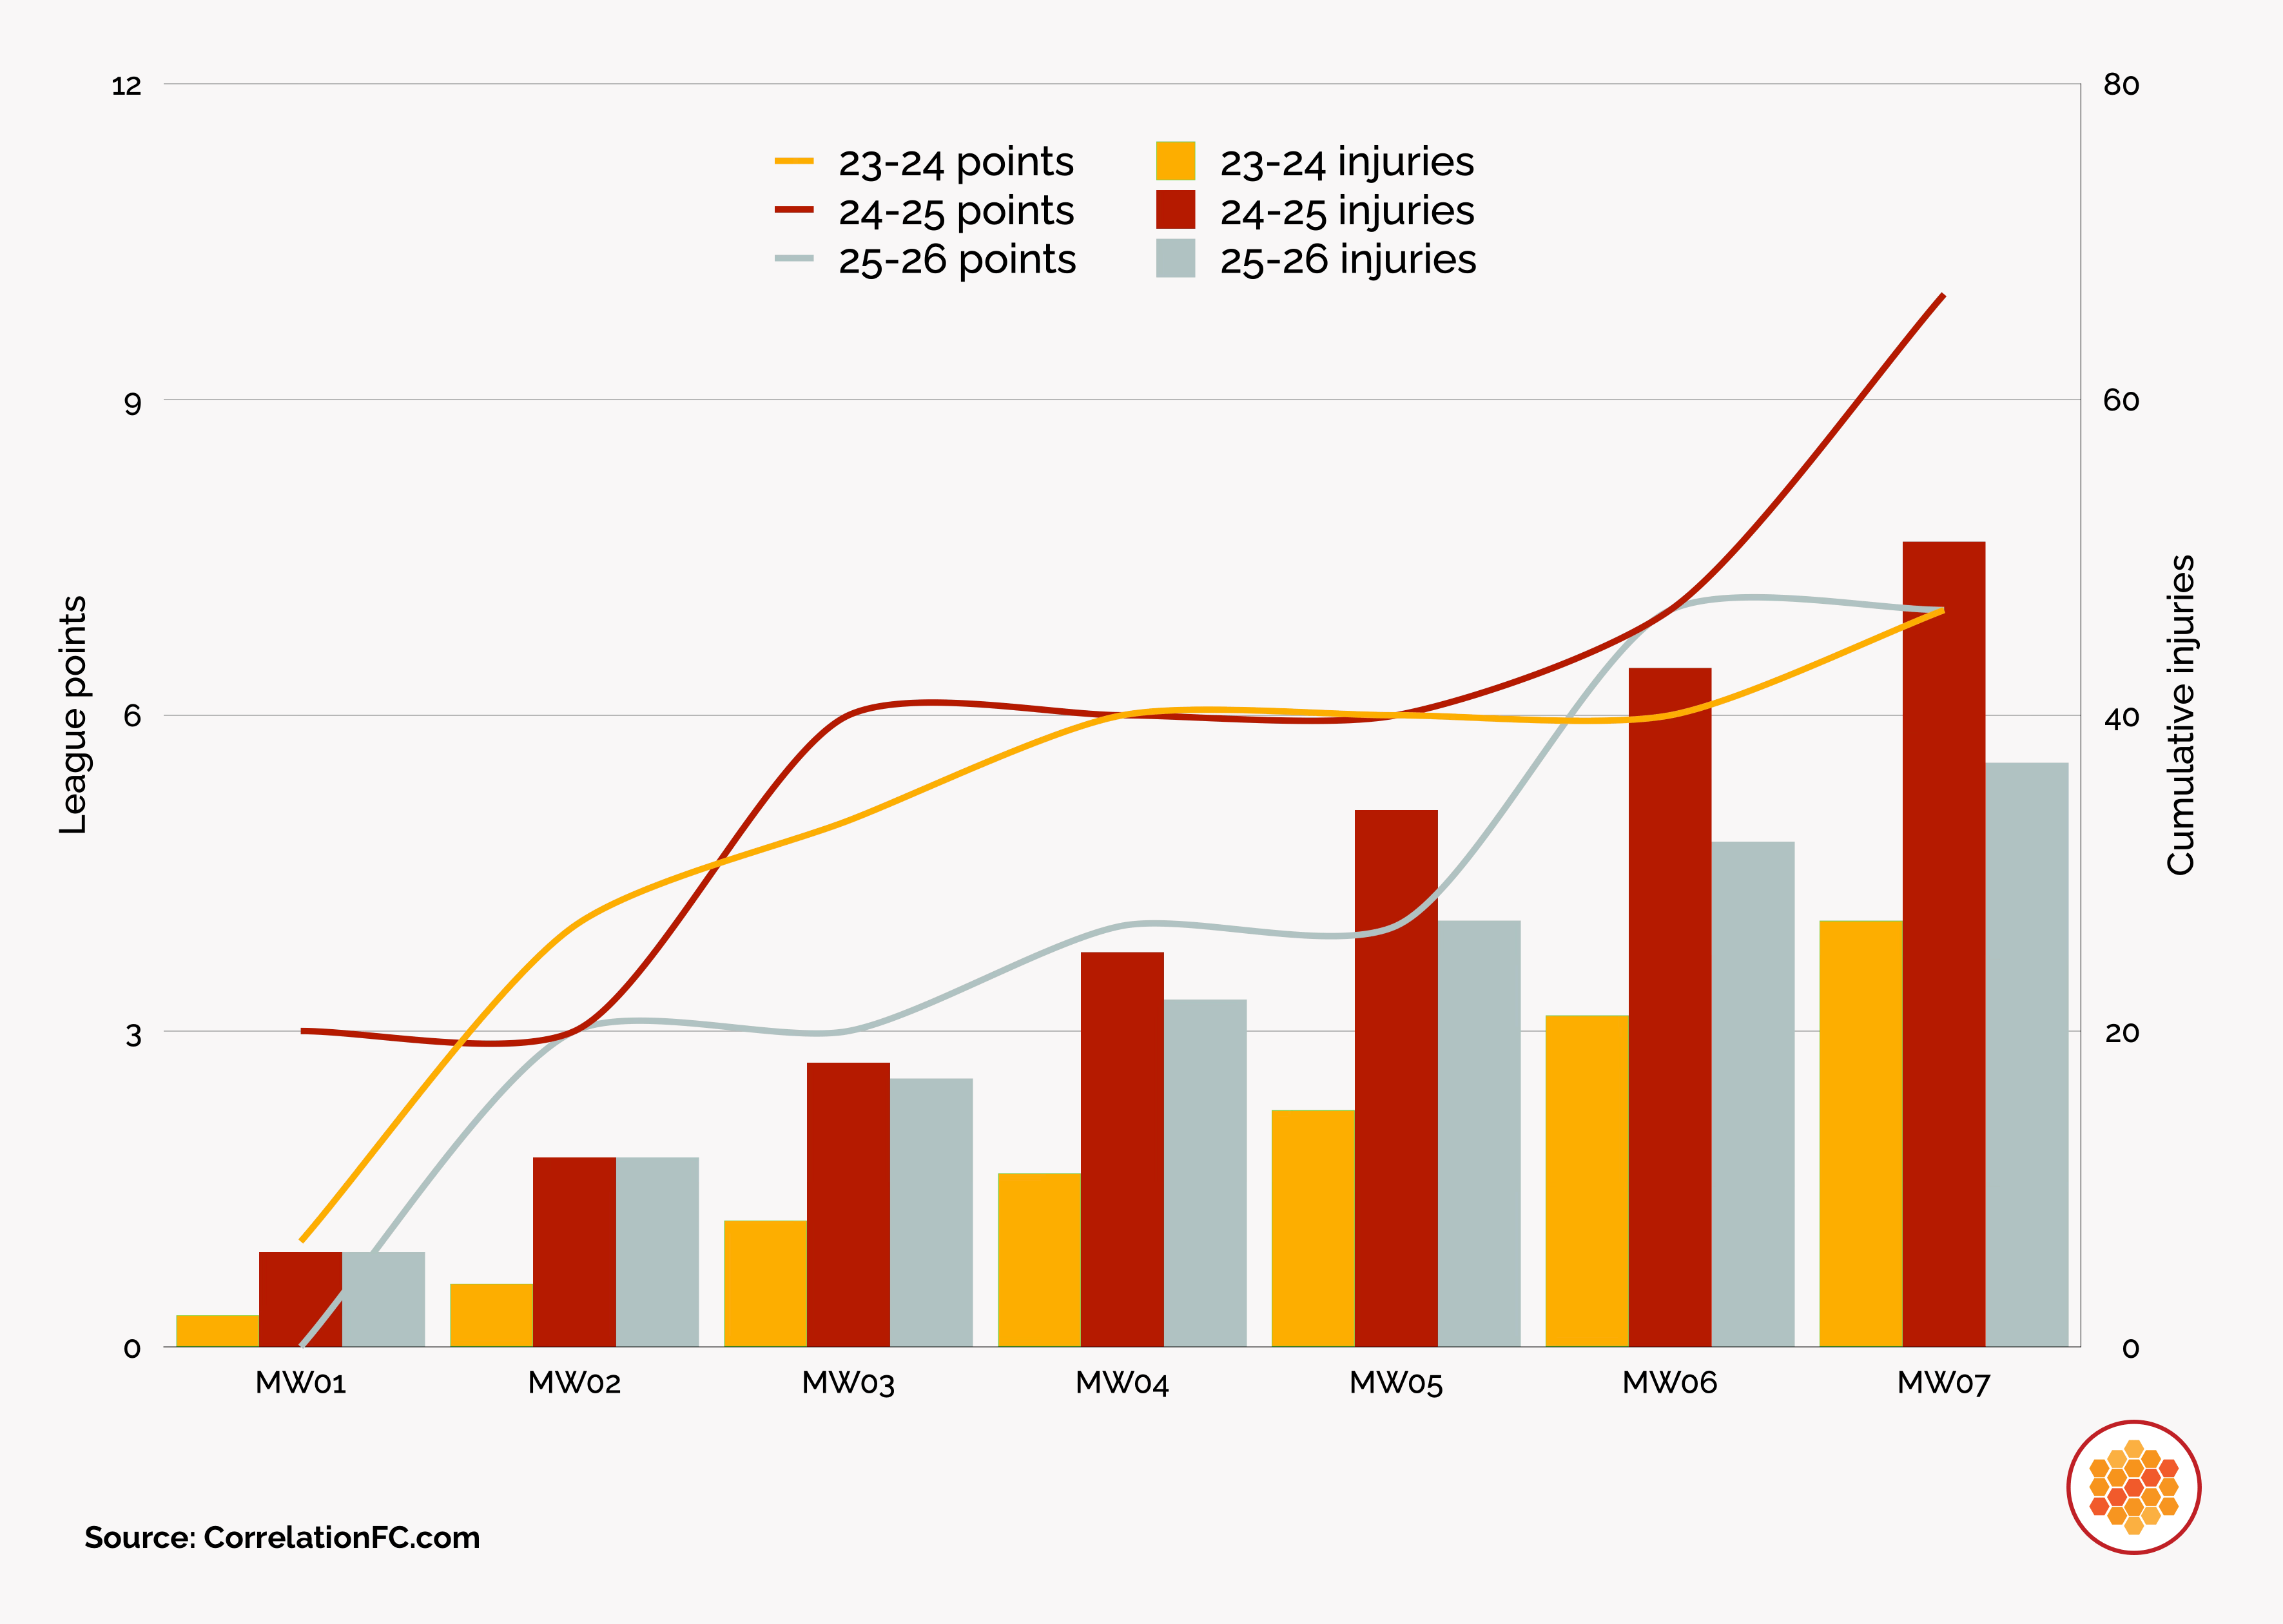
After a summer of change, the squad has been in good shape. Keith Andrews has not yet needed to make a change to his starting lineup due to injury (though Mikkel Damsgaard did miss a game due to illness). Compared to last season, the Bees have suffered fewer injuries yet achieved fewer points. However, they have the same number of points with more injuries than two seasons ago.
Cumulative injuries and point totals (source: Correlation FC)
Squad depth
Andrews has used 20 different players in the league so far this year. Compared to the first 7 league games last season, Andrews has made more subs than Thomas Frank, but his substitutes are getting slightly fewer minutes on average than a season ago. Nathan Collins, Caoimhin Kelleher and Sepp van den Berg have played all 630 league minutes so far this season.
Comparison of substitutes usage in the first 7 league games (Source: Correlation FC)
| Season | Subs per game | Average start duration | Average sub duration |
|---|---|---|---|
| 2025-26 | 4.6 | 84.3 | 14.0 |
| 2024-25 | 3.9 | 84.6 | 15.9 |
Goals
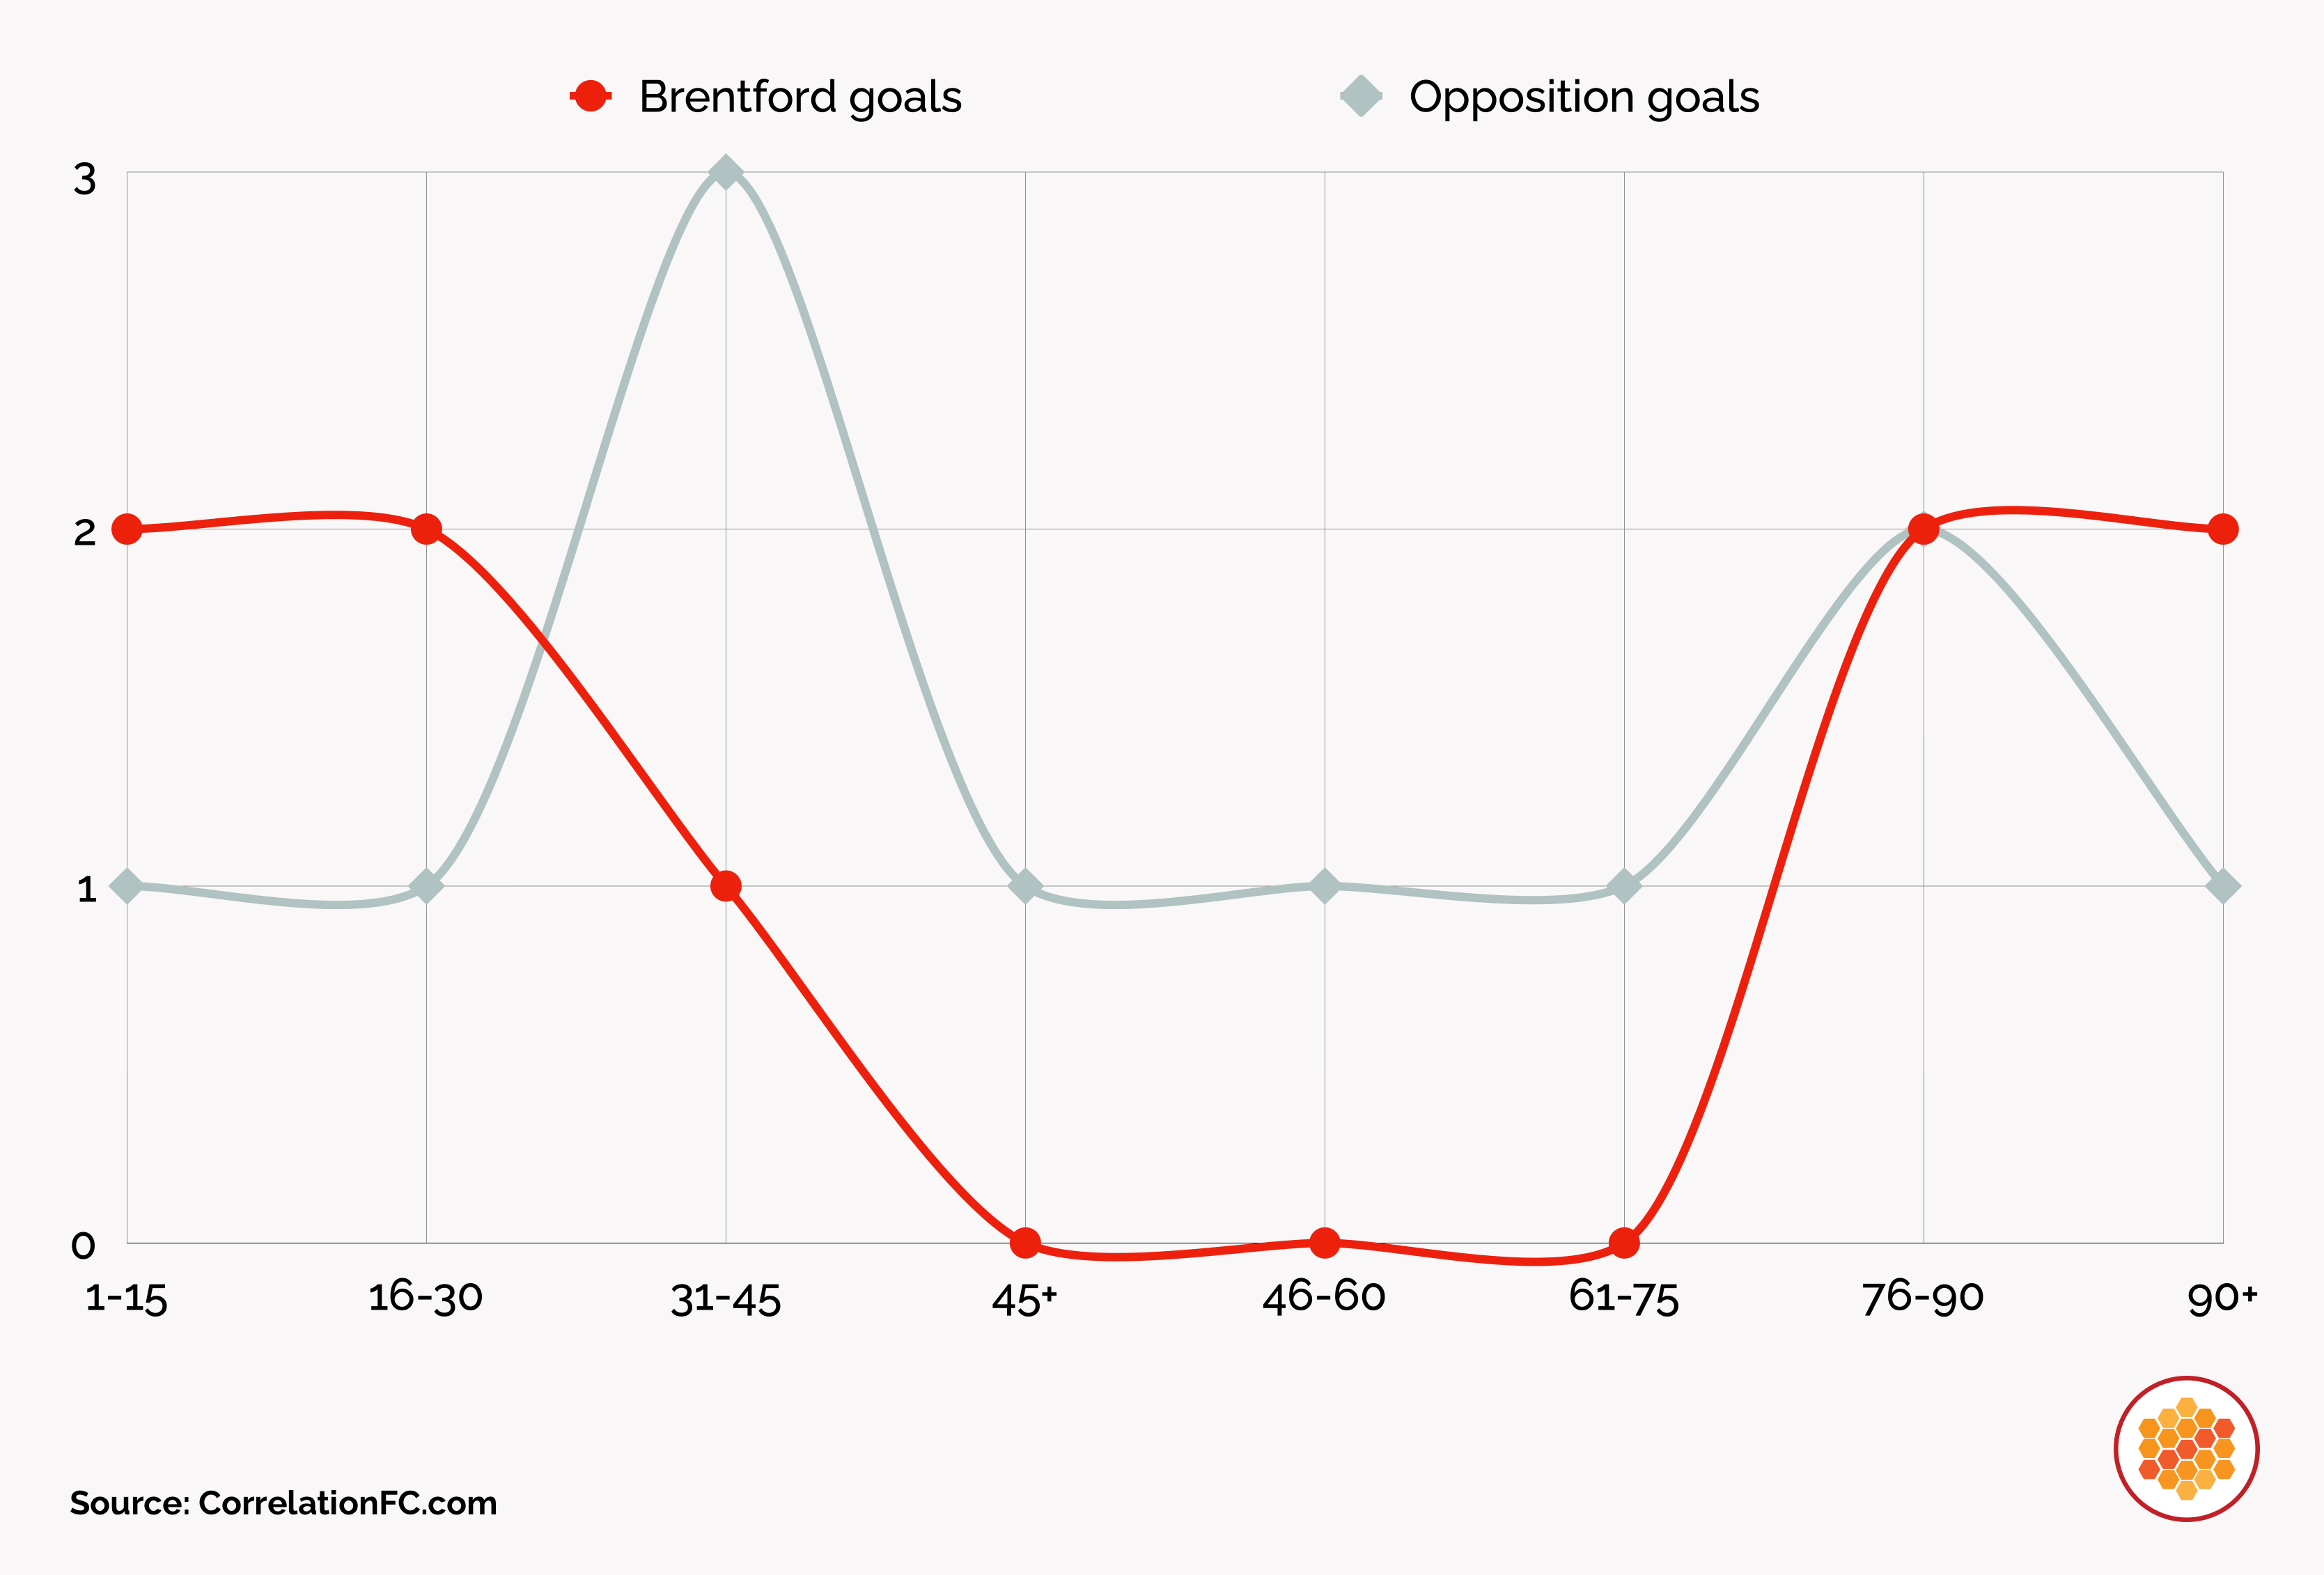
Goal timing
The Bees famously scored goals in the first minute (or two) of four consecutive league games last season. While they haven't scored that early this season, they have scored first in most of their league games so far. They've also been scoring late in the game as well. Let's look at the breakdown over the different phases of the game for both goals for and against the Bees.
Goal timing during 2025-26 Premier League season (source: Correlation FC)
Who is scoring?
The Bees lost plenty of goals over the summer as Mbeumo, Wissa and Norgaard left, but Igor Thiago has helped fill that void. Let's look at the rest of the players who have added goals and assists – note that we're including our unofficial goal contributions within these stats. CFC Goal Contributions – all competitions, 2025-26 as of 15th October 2025
Brentford's top goal contributions in 2025-26 (all competitions) (Source: Correlation FC)
| Player | Goals | Assists | Total contributions |
|---|---|---|---|
| Thiago | 5 | 1 | 6 |
| Schade | 1 | 4 | 5 |
| Carvalho | 2 | 1 | 3 |
| Onyeka | 0 | 3 | 3 |
| Damsgaard | 1 | 1 | 2 |
| Jensen | 1 | 1 | 2 |
| Ajer | 0 | 2 | 2 |
| Henderson | 0 | 2 | 2 |
| Yarmoliuk | 0 | 2 | 2 |
Goal scenarios
The Bees have been creative, scoring goals in a number of different ways so far this season, but surprisingly, they haven't scored any goals from corners yet.
Brentford's goal scoring scenarios (all competitions) (Source: Correlation FC)
| Scenario | Count |
|---|---|
| Penalty | 1 |
| Open play | 5 |
| Free kick | 1 |
| Open play (counter) | 3 |
| Throw in | 2 |
| Corner | 0 |
| Total goals | 12 |
Strength of schedule
In terms of results, the Bees have had a bit of a mixed start to the season. Is there any sort of silver lining to it? We know that they've played some teams that finished above them last year (e.g. Manchester City, Aston Villa, Nottingham Forest) but they've also played a newly promoted team (Sunderland).
We want to use data to help us to understand how difficult the Bees' schedule has been. One way that we can do this is to use Opta's Power Ranking. So, we've taken snapshots of that data before every game this season and run the numbers to see how things break down across the league.
League points and fixture difficulty (source: Correlation FC)
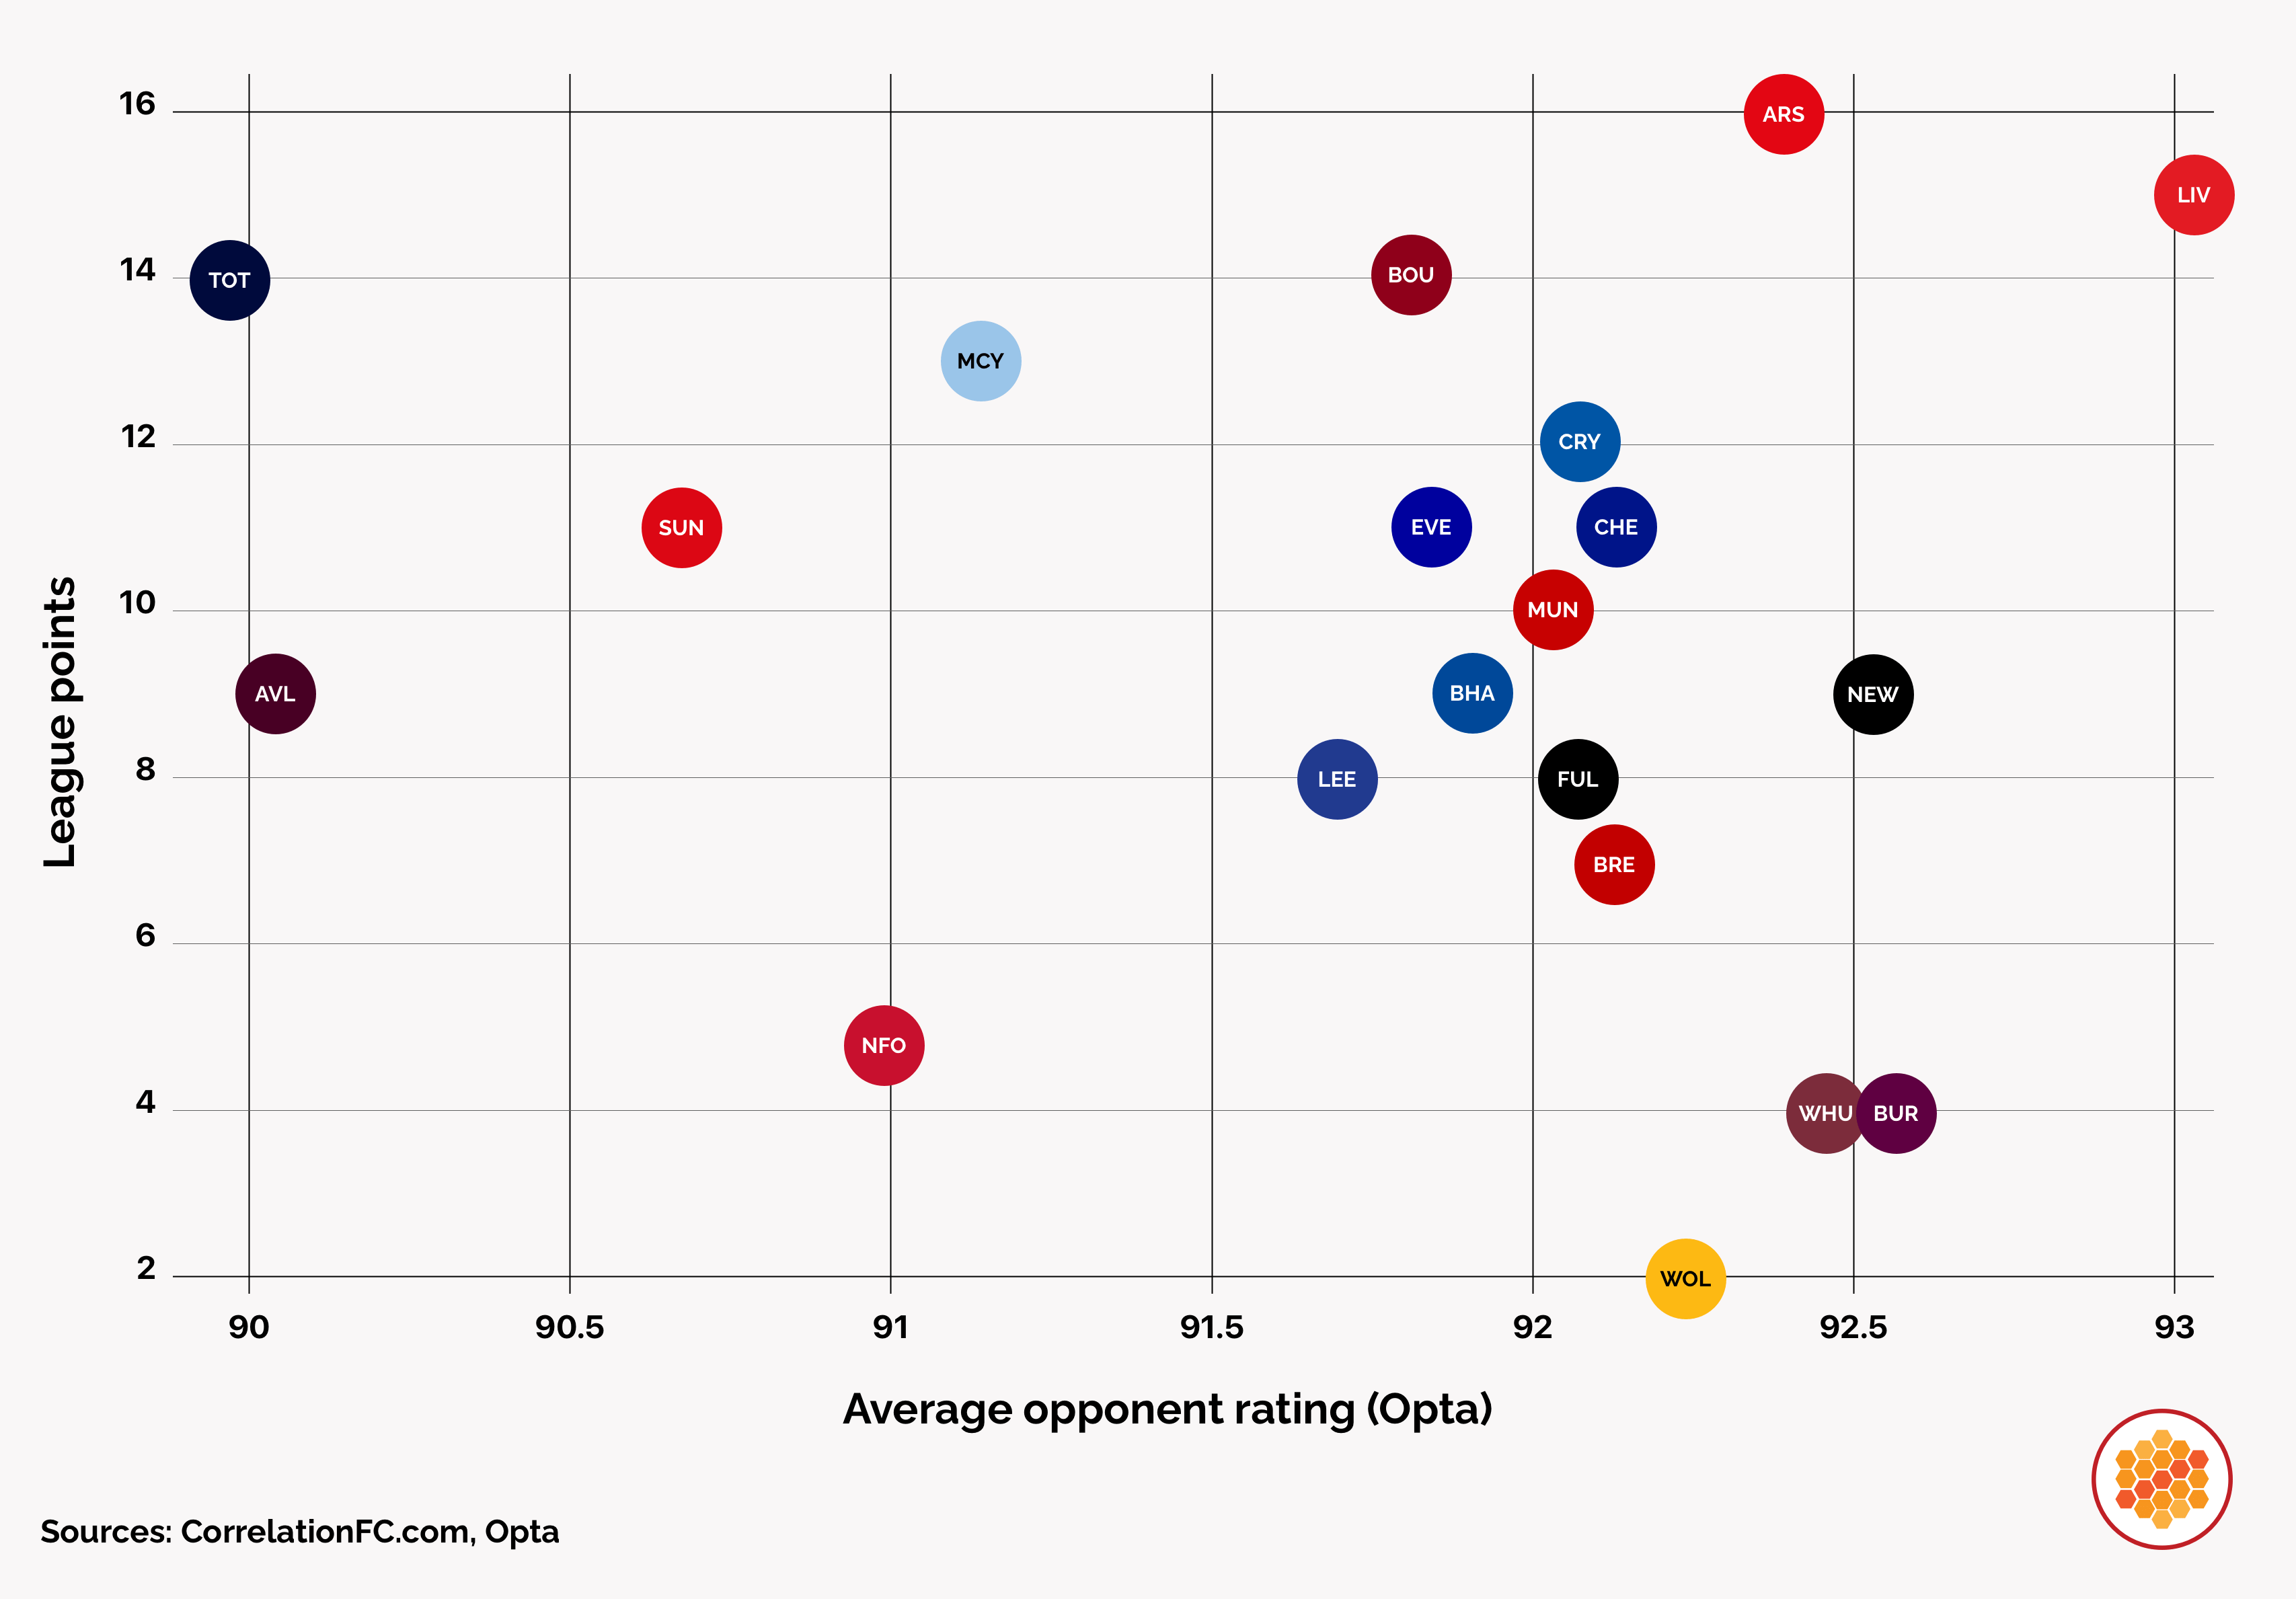
Looking at the graphic, in the top right corner, we can see the teams that have the most points and have faced the most difficult opponents. While Arsenal has one more point, Liverpool has had a more difficult schedule.
In the bottom right corner, you can see a trio of teams that have very few points, but have had difficult schedules. They may find a bit of relief as their schedule eases up a bit, though hopefully West Ham won't find their form until after the Bees travel there later this month.
The bottom left corner is sparsely populated – that's the low performers who have also had relatively easy opponents. This doesn't bode well for Nottingham Forest.
In the top-left corner, we see the teams with relatively high point totals who have also faced comparatively easy opponents. This corner is also home to two of the league's surprising performers this year with Tottenham and Sunderland both exceeding expectations.
So where are the Bees? They've picked up an average of 1 point per game against relatively difficult opponents. Below, we display the same data in a data table.
A game-by-game view
Above, we looked at averaged-out data for the entire season. Here, we break it down to look at it game-by-game to understand how the Bees' opponents' relative strength has impacted results through the lens of goal difference.
Goal differences based on Opta Power Rankings (source: Correlation FC, Opta, FBref)
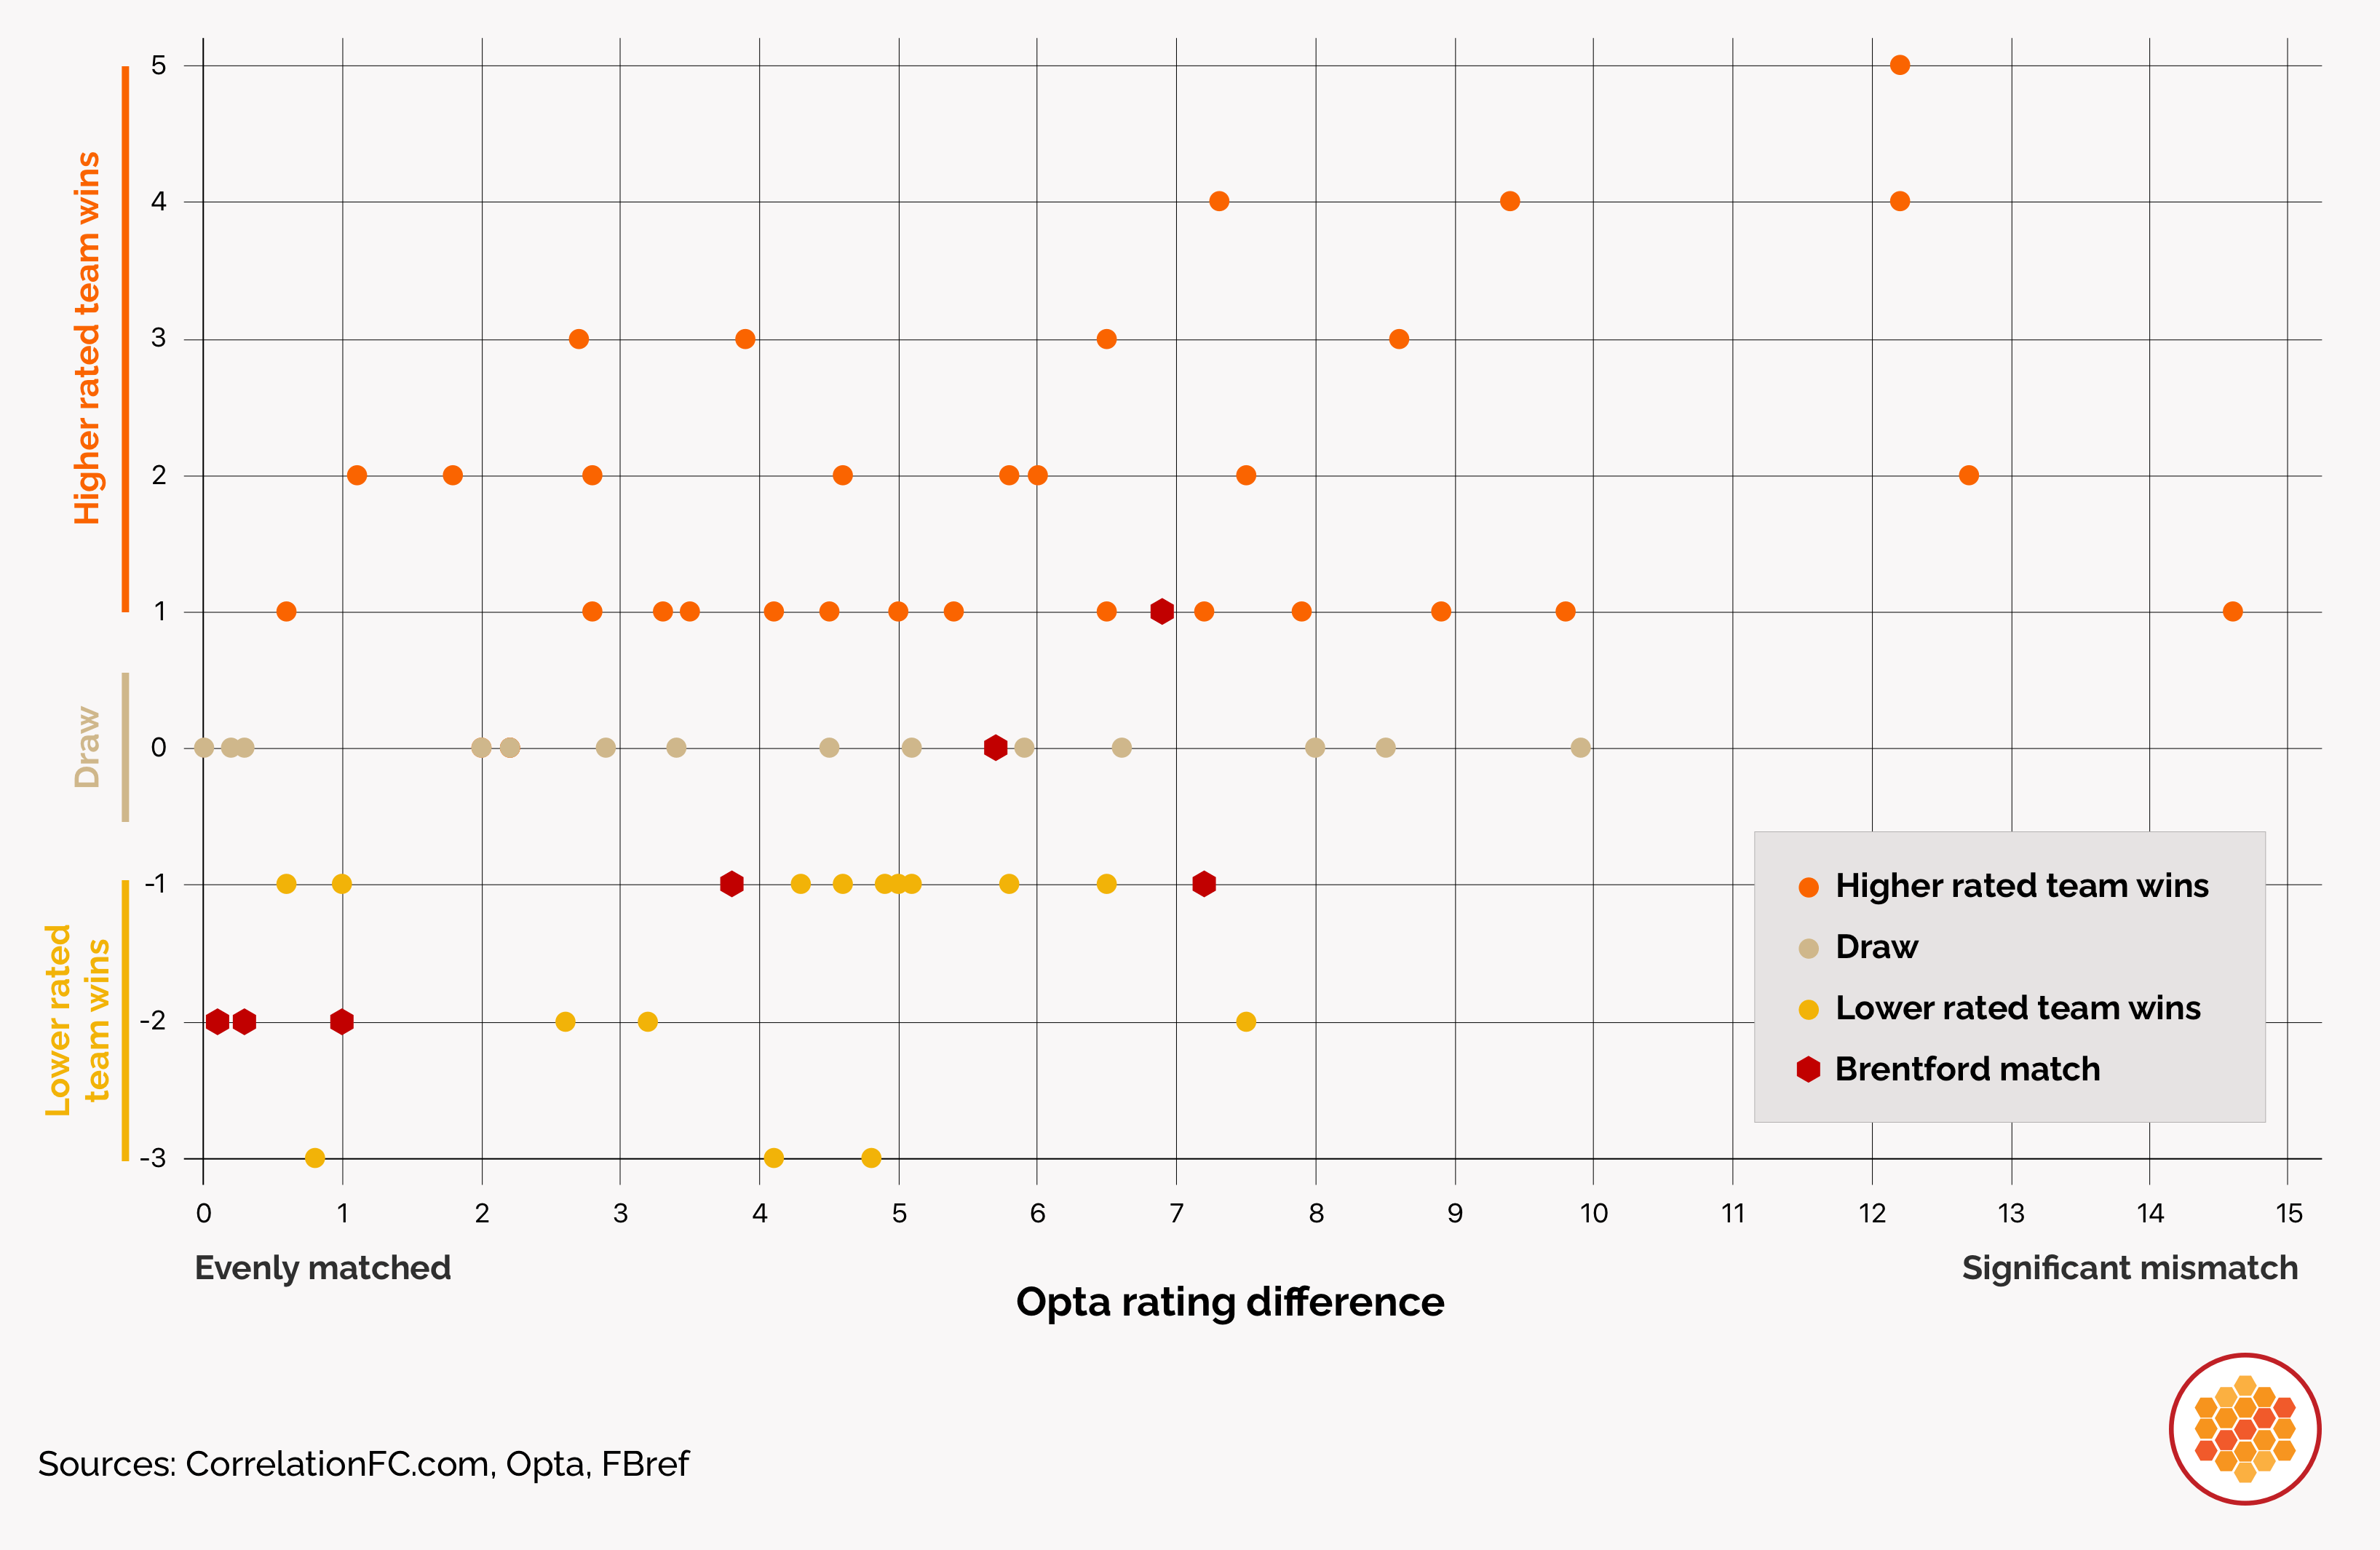
This busy chart can tell us many things. Generally speaking, when the rating difference between the teams is high – for example, Manchester City vs Burnley – the higher-rated team has won every game, often by several goals.
As the rating difference decreased – meaning the teams are more evenly matched – the outcomes are more varied. This seems intuitive.
Overall, higher-ranked teams have won 31 of 69 games this season, a win rate of 45%. There has only been one game so far where both teams had an equal Opta Power Ranking (Aston Villa vs Newcastle), and not surprisingly, the game ended in a draw.
How have the Bees fared? In the bottom left corner, you can see that three of their games were played against similarly ranked opponents, with each ending in 2-goal differences (losses to Forest and Fulham, and a win against United). As you move to the right, you can see Brentford's other performances. The most unusual part of Brentford's results this season is that the higher rated team has only won 1 of the 7 games so far, a win rate of 14%, far below the league average.
What's next?
Between now and the next international break, the Bees play five times, with only two of those coming at home. The first of those home games is against last season's champions, Liverpool, with the other coming against the always difficult Newcastle. Away from home, the Bees will take on West Ham, Grimsby Town in the EFL Cup and Crystal Palace.
On the current international break, both Aaron Hickey and Antoni Milambo have picked up injuries. The Bees have announced that Milambo will miss the rest of the season due to an ACL injury. The extent of Hickey's injury isn't known yet. More injuries will surely force Andrews and the Bees to adapt. We'll have to stay tuned to see how the next phase of the season plays out.
This story was published on 13 October 2025. It was written by Dennis Flood. The image at the top of this story was generated using AI.